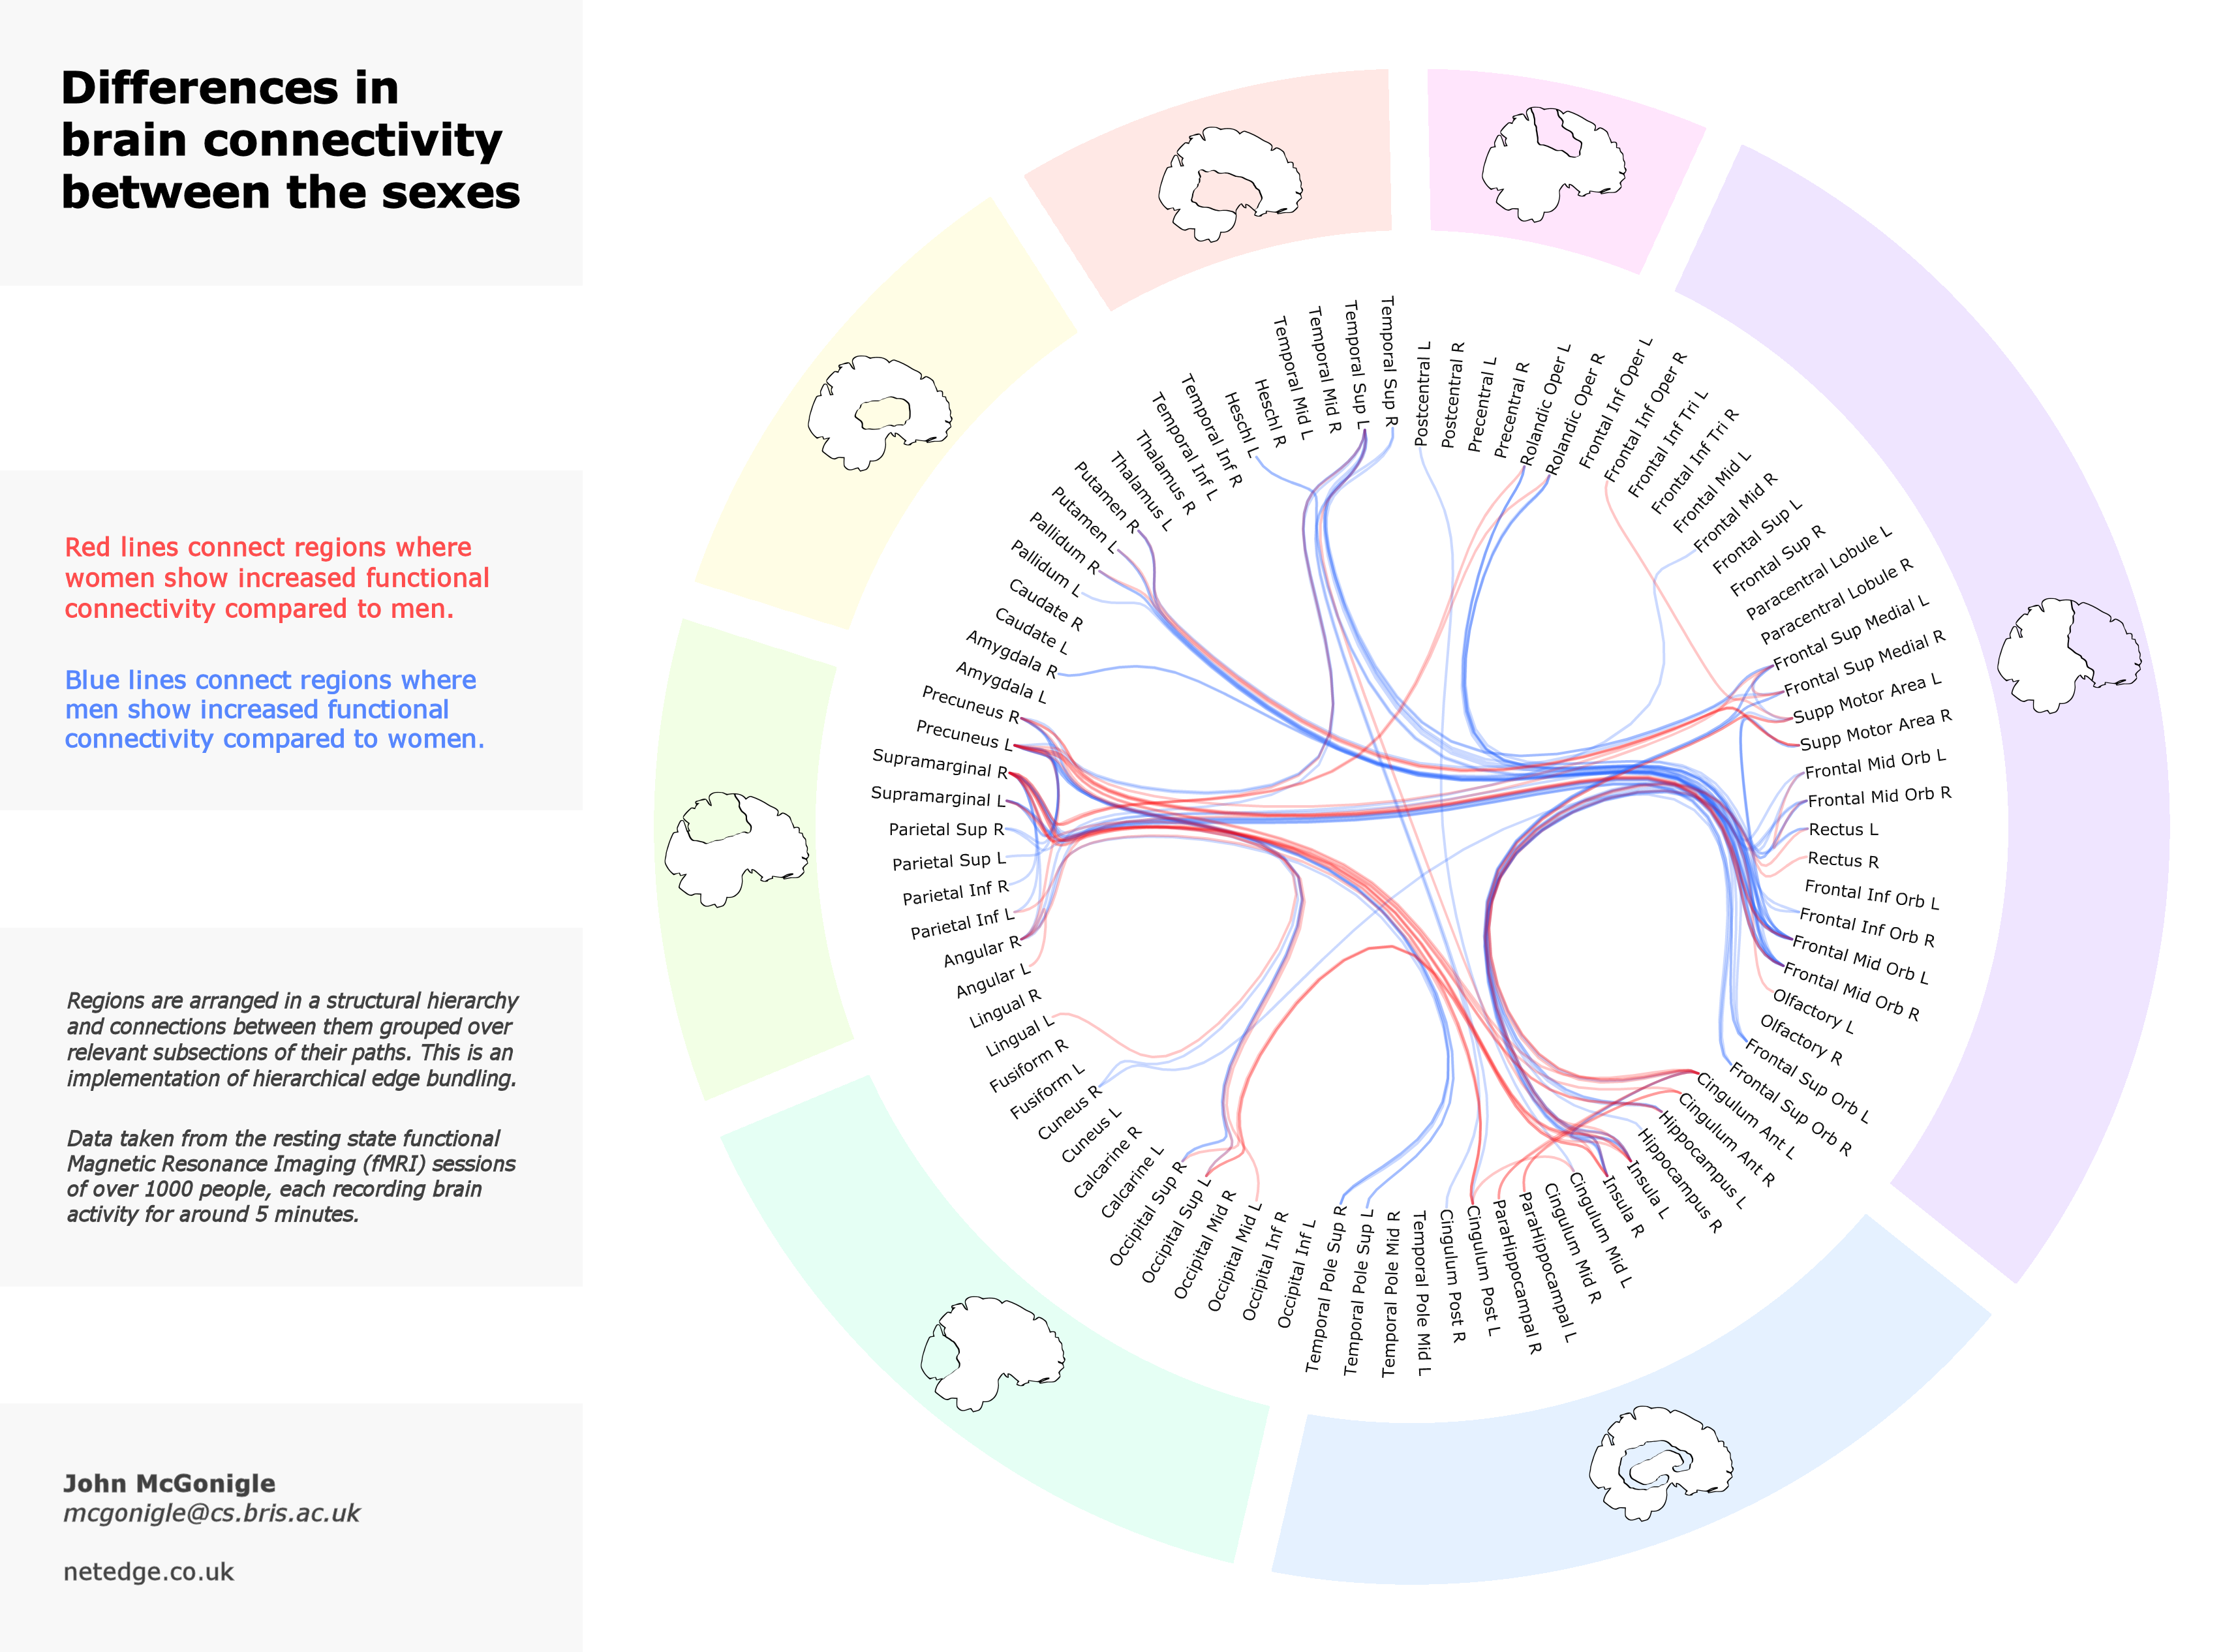
Functional connectivity differences between the sexes visualised using hierarchical edge bundling
Red lines connect regions where women show increased functional connectivity compared to men. Blue lines connect regions where men show increased functional connectivity compared to women. Regions are arranged in a structural hierarchy and connections between them grouped over relevant subsections of their paths. This is an implementation of hierarchical edge bundling. The edges shown are those which are significantly different (p<0.05) between sexes after a multiple comparisons correction. Data taken from the resting state fMRI sessions of over 1000 people. We showed a similar figure in [1] using different data. [1] Adam J. Schwarz, John McGonigle. Negative edges and soft thresholding in complex network analysis of resting state functional connectivity data. NeuroImage, Vol. 55, Issue 3 (2011), pp 1132-1146. http://dx.doi.org/10.1016/j.neuroimage.2010.12.047 Some of these diagrams will be presented at poster 709 (Visualising functional connectivity in fMRI using hierarchical edge bundles) at this year's conference.

