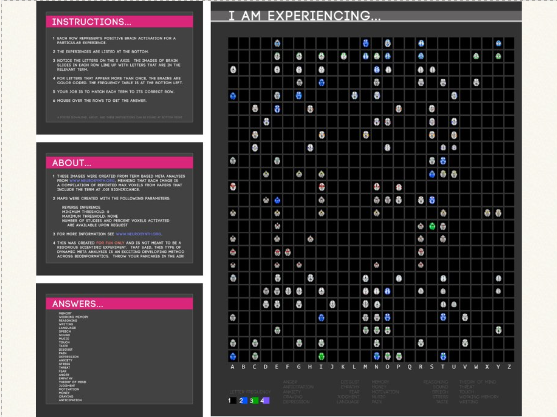
I am Experiencing: matching terms to brain activation
This poster asks the viewer to match brain activation maps with the correct term that describes the activation. Each row represents positive brain activation for a particular experience; experiences are listed across the bottom. The images of brain slices in each row line up with letters that are in the relevant term; the letters are on the x axis. For letters that appear more than once in a term, the brains are color coded, corresponding to a frequency table in the bottom left. The maps were created via NeuroSynth.org, a beta interface that produces meta analysis maps by compiling max voxels mined from journal articles based on term frequency. This image does not claim to be scientifically rigorous, but rather a fun exercise.

