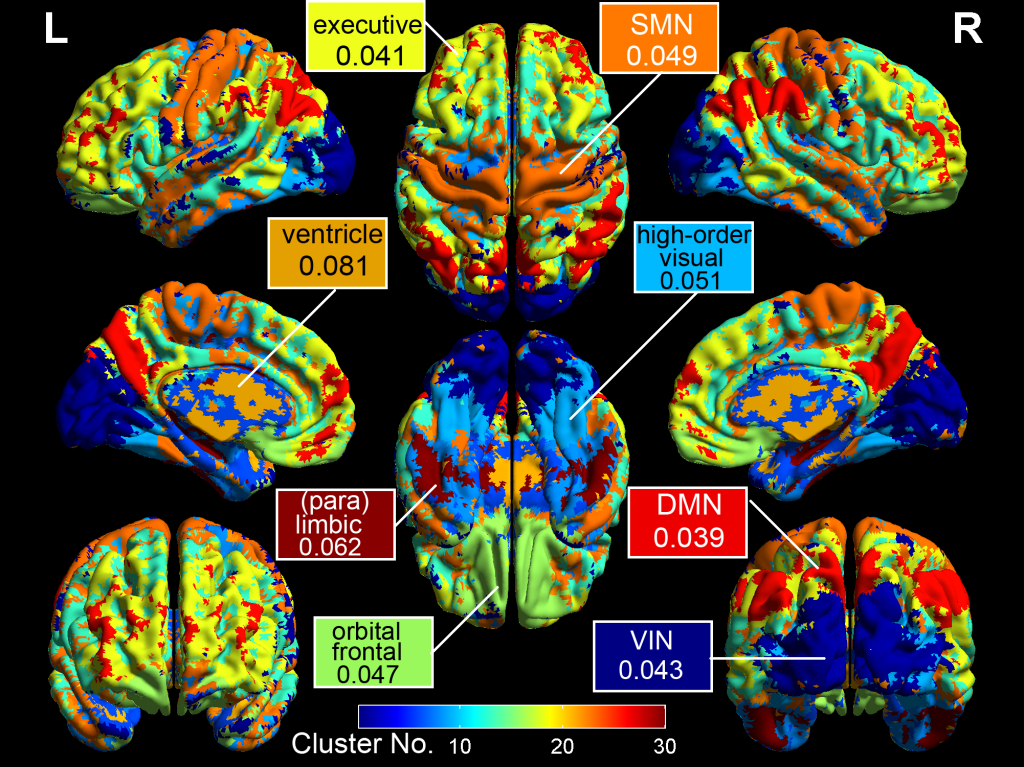
Frequency clustering analysis of the resting-state human brain
In fMRI studies, functional connectivity has revealed the coupling strength of different brain nodes, however it hasn't answer the question through what frequencies these assemblies were integrated. The presented figure shows the result of frequency clustering analysis where voxels fall naturally into clusters (indicated by different colors).Clusters that are consistent with some canonical networks are labeled, the mean frequency values (with a unit of Hz) for these clusters are indicated in the labels.

