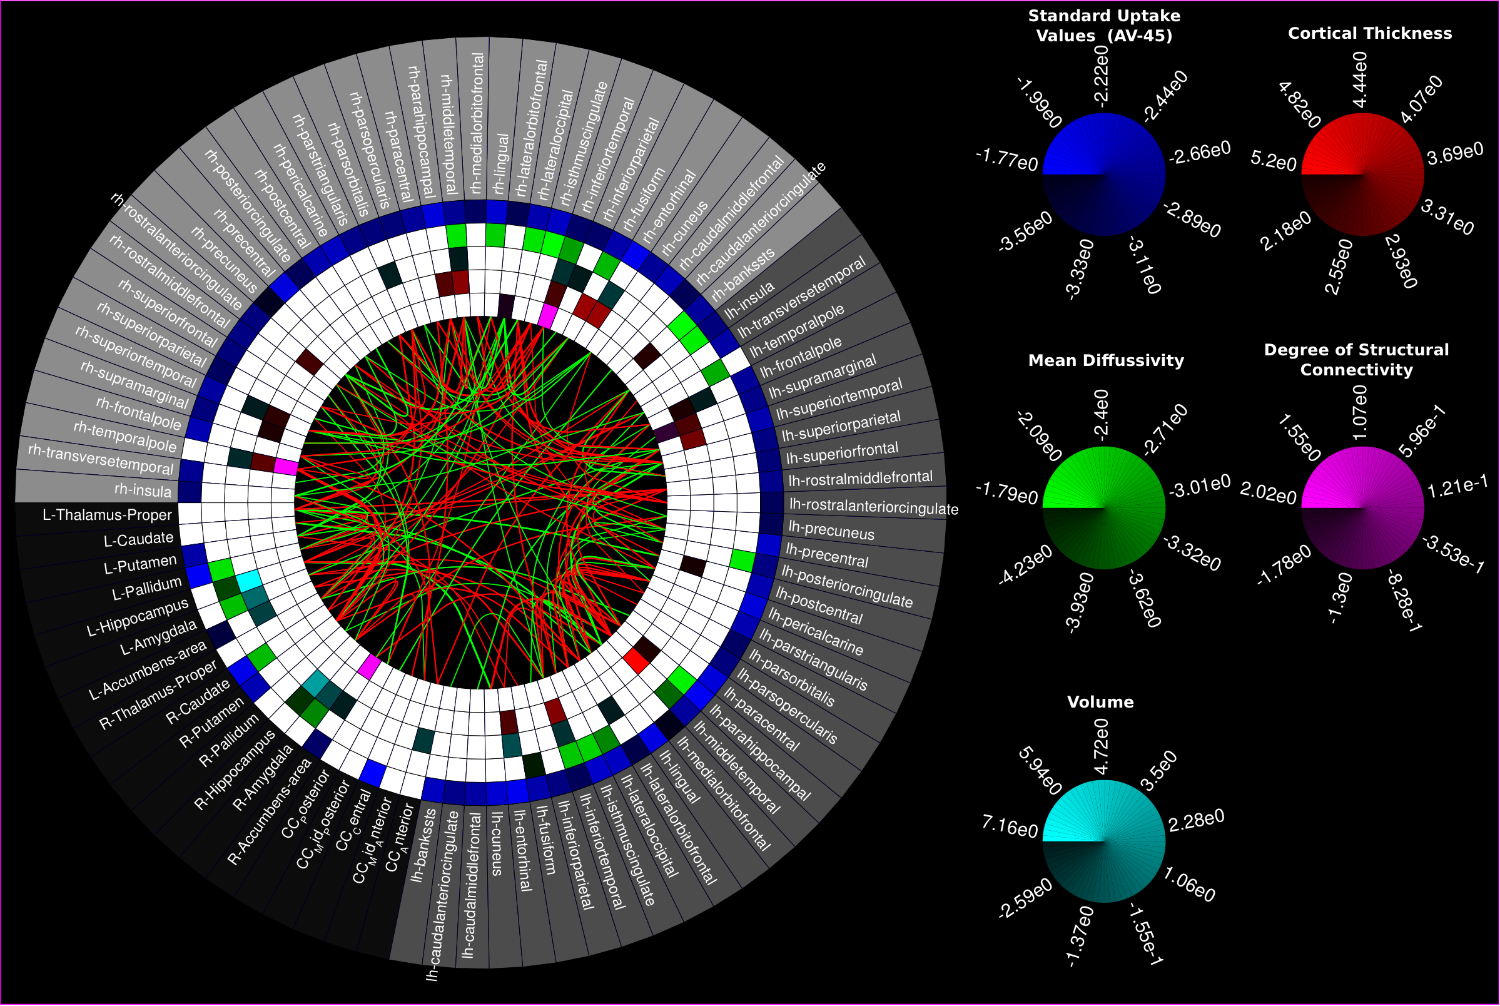
A group difference connectogram
The connectogram (generated using the MIBCA toolbox) illustrates the significant differences between healthy subjects and Alzeihmer Disease patients for VOI-based Standard Uptake Value (AV45), Mean diffusivity, volume, cortical thickness and Degree of Structural connectivity (as rings of the connectogram), and gain (green lines) and loss (red lines) structural connections between pairs of VOIs.

